
How Data Insights Drive Smarter Decisions
Every service your team runs produces a steady stream of data: response times, error counts, log lines, build results, deploy timestamps. None of it is valuable on its own. Value appears only when that data becomes a clear insight that changes what someone does next — roll back a release, add capacity, rewrite a noisy alert or tell customers what is going on.
This guide explains how to get from raw operational data to confident, timely decisions. It covers which signals deserve attention, a simple loop for acting on them, how to share insights across teams without endless debates about numbers, and how to keep the whole process sustainable as you grow. The examples come from DevOps work — monitoring, logging, CI and status pages — but the same principles apply to any team that wants decisions grounded in evidence rather than guesswork.
Many teams struggle with fragmented data. Information is stored across different tools, dashboards, and spreadsheets, making it difficult to see the full picture. Exana simplifies this complexity by bringing data together into a unified analytical environment. Once data is connected, the platform focuses on what matters most: extracting insights that are relevant, accurate, and easy to understand—an approach that mirrors how structured platforms like ugwin288 prioritize clarity and centralized control.
Key takeaways
- An insight is data that changes a decision. If a chart never changes what anyone does, it is noise.
- Start with a handful of signals tied to user impact: availability, error rate, latency and change failure rate.
- Use a repeatable loop — observe, explain, decide, act, review — so insights turn into action every time.
- One shared source of truth ends arguments about whose numbers are right and moves the discussion to priorities.
- Automate collection and alerting, but keep humans in charge of judgment and trade-offs.
From raw data to meaningful insight
Most teams do not suffer from a lack of data. They suffer from data scattered across too many places: uptime checks in one tool, application logs on individual servers, build results in a CI dashboard and incident notes in a chat thread. When something goes wrong, someone has to stitch these fragments together by hand, and the picture they produce depends on who did the stitching.
The first step towards better decisions is bringing those sources into a consistent view. That does not require a large data platform. It requires three things: centralised collection, so every signal lands somewhere searchable; shared definitions, so "error rate" or "downtime" means the same thing to everyone; and context, so a spike in errors can be lined up against the deploy or configuration change that preceded it. Centralised logs are often the quickest win here — our guide to incident-ready logging for small DevOps teams shows how to set this up on a single server.
Once data is connected, the goal shifts from collecting more to extracting what is relevant. A useful insight is specific ("checkout latency doubled for EU users after the 14:05 deploy"), explained ("a new database query lacks an index") and actionable ("roll back now, add the index, redeploy tomorrow"). Insights presented this way are understood by engineers and managers alike, which is what makes fast alignment possible.
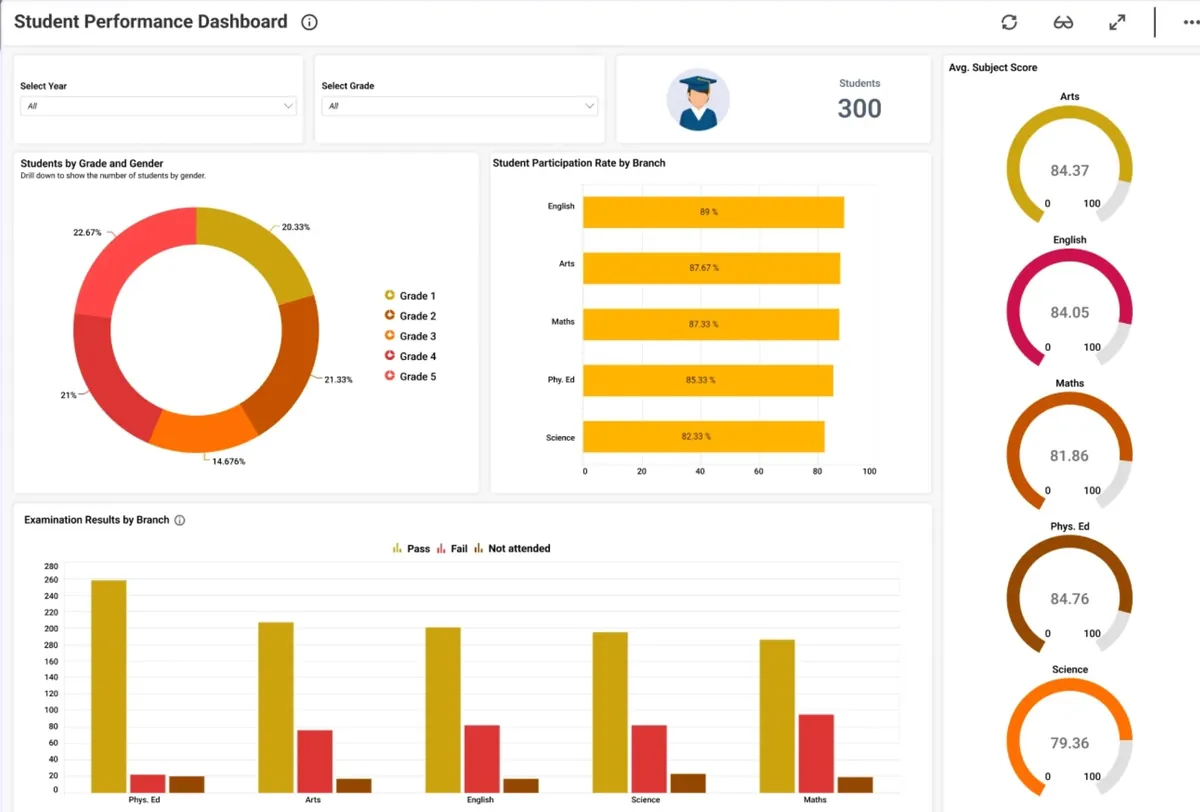
The signals that actually matter
It is tempting to track everything. In practice, a small set of well-chosen signals tells you far more than hundreds of charts nobody reads. Pick signals that map directly to a question someone needs answered during normal work or an incident:
| Question you need answered | Signal to watch | Where it comes from |
|---|---|---|
| Are users affected right now? | Availability against an SLO, error rate | Availability monitoring |
| Is the service getting slower? | p95 / p99 latency for key journeys | Monitoring and application metrics |
| What changed before the problem started? | Deploy history, build results, change failure rate | CI/CD pipeline |
| Why did it fail? | Structured errors, stack traces, request IDs | Centralised logging |
| Who needs to know, and what do we tell them? | Incident state, affected components, ETA | Status page |
Notice that each row starts with a question, not a metric. That is deliberate. Metrics chosen because they are easy to collect tend to become vanity numbers; metrics chosen because they answer a real question tend to drive decisions. If you are just starting, the four signals in the first and third rows — availability, error rate, latency and change failure rate — cover most of what a small team needs.
Turning insights into actionable decisions
Insights only deliver value when they lead to action. Static dashboards that someone glances at once a week rarely change anything. What works is a short, repeatable decision loop that every on-call engineer and team lead can follow:
- Observe. A signal crosses a threshold or a trend changes direction — for example, error rate climbs above 1% for ten minutes.
- Explain. Correlate the change with context: recent deploys, traffic shifts, dependency incidents, log patterns.
- Decide. Choose an action and an owner. Roll back, scale up, apply a fix or consciously accept the risk.
- Act. Carry out the decision and communicate it, internally and on the status page if users are affected.
- Review. Check whether the signal recovered and capture what you learned so the next decision is faster.
How good data insights support smarter decisions
- They identify the key drivers behind performance changes instead of just reporting that something changed.
- They surface trends early, before a slow degradation turns into an outage.
- They provide context — what changed, when and for whom — so choices are made with confidence.
- They reduce manual analysis, freeing engineers to work on fixes rather than on gathering evidence.
When insights arrive in real time or close to it, leaders can act while the decision still matters. Whether the choice is rolling back a release, re-prioritising a sprint or investing in capacity before a seasonal peak, it is grounded in evidence rather than assumptions. For a broader, business-level view of the same idea, see data-driven decisions: turning analytics into real business value.
Enabling collaboration across teams
One of the biggest obstacles to data-driven work is trust. If engineering, support and management each look at different numbers, meetings turn into debates about whose figures are correct. A single, shared source of truth changes the conversation: everyone sees the same availability figure, the same incident timeline and the same trend, so discussion moves from arguing about data to agreeing on actions and priorities.
Collaboration also means making insights accessible to people who do not write queries. A support lead should be able to see whether an issue is already known; a product manager should be able to see how often a feature fails. Public or internal status pages for small DevOps teams are a simple way to do this: they turn monitoring data into plain-language updates that customers and colleagues can follow without asking engineers for a summary.
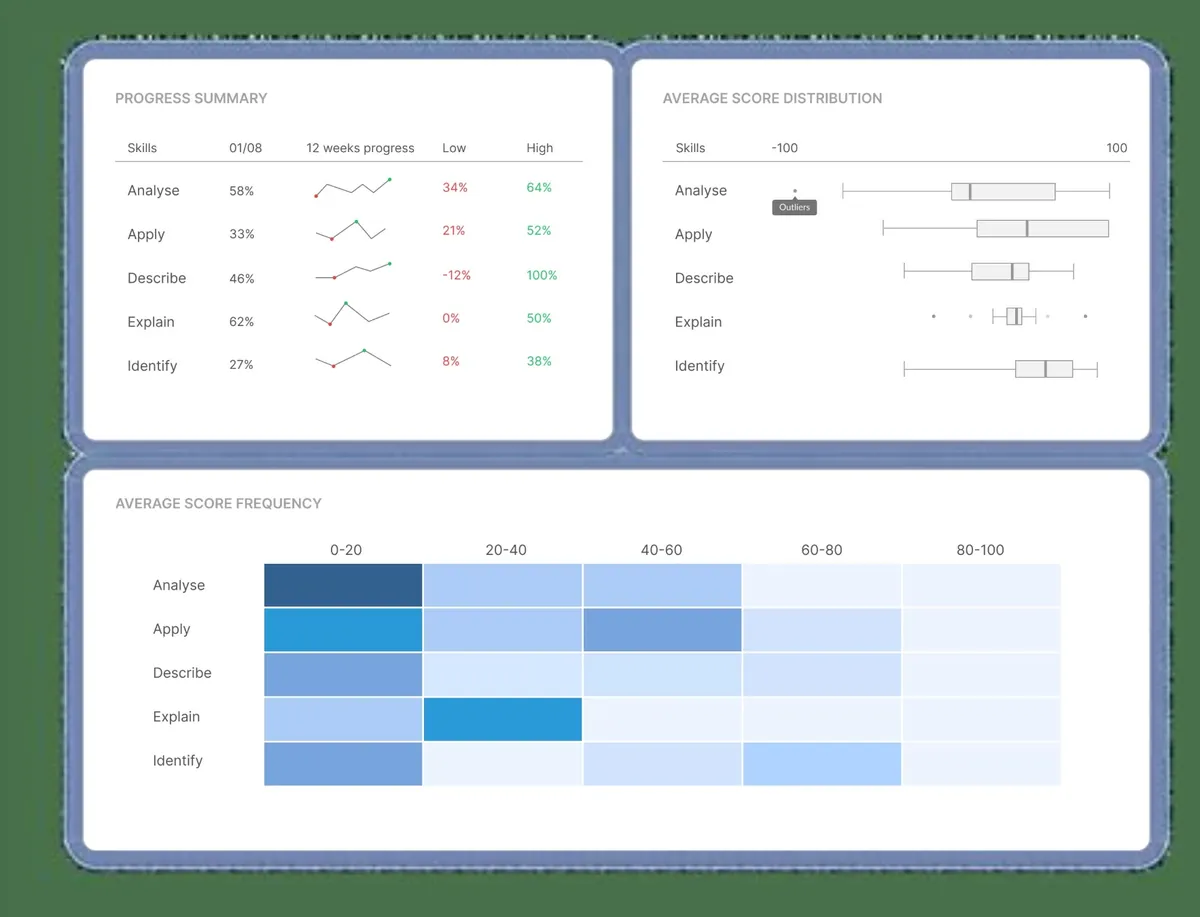
Scaling smarter decisions with automation
As systems and teams grow, manual analysis becomes a bottleneck. Nobody can watch every graph, and a process that depends on one experienced engineer noticing a pattern does not scale. Automation keeps insights consistent and available at every stage of growth:
- Collect automatically. Ship logs and metrics from every host and every build, so gaps do not appear exactly where you need evidence.
- Alert on symptoms, not causes. Page people when users are affected (SLO burn, error rate), and route lower-priority signals to a daily review instead.
- Annotate changes. Mark deploys and configuration changes on graphs automatically, so correlation takes seconds rather than minutes.
- Prune regularly. Remove alerts that fired without anyone acting on them. Alert fatigue destroys trust in data faster than anything else.
Automation does not replace human judgment. It removes repetitive work so people can concentrate on the decisions that need experience and context. Running your own build and test infrastructure is a good example of where automation pays off quickly; our article on self-hosted CI runners in 2026 walks through a practical setup.
Building a data-driven culture
Tools are only half of the story. Smarter decisions also depend on habits. Teams that consistently decide well tend to share a few practices:
- They write blameless post-incident reviews that start from the data, not from opinions.
- They review a short set of trends every week and agree on one or two improvements.
- They set explicit targets, such as SLOs, and revisit them each quarter.
- They make it normal to ask "what does the data say?" before committing to a plan.
Watch out for the common pitfalls: vanity metrics that always look good, dashboards built for a single meeting and never updated, and alerts without a clear owner. Each of these erodes trust, and without trust people fall back on intuition. When teams trust their data and understand what it means, decisions become faster, more transparent and more consistent — leaders gain clarity, engineers gain autonomy, and the organisation gains a stronger foundation for sustainable growth.
Why Exana makes the difference
Exana provides the operational building blocks that make data insights possible without running the tooling yourself: availability monitoring, hosted log management, Buildbot hosting for CI/CD and status pages. Because these services work together, uptime, logs, builds and incident communication tell one coherent story.
If your goal is to turn scattered operational data into confident action, explore Exana's products, read the documentation and FAQ or contact the team to discuss your setup.
Frequently asked questions
What is the difference between data and a data insight?
Data is the raw record: a response time, a log line, a failed build. An insight is a conclusion drawn from that data that changes what you do next, for example that error rates rise after every Friday deploy, so releases move to Tuesday.
Which metrics should a small DevOps team track first?
Start with four: availability against an SLO, error rate, latency for the main user journeys and deployment frequency with change failure rate. Together they show whether users are affected and whether recent changes caused it.
How do you stop dashboards from turning into noise?
Give every chart and alert an owner and a question it answers. If nobody can say what decision a panel supports, or an alert fires without anyone acting on it, remove it or merge it into an existing view.
How often should teams review their metrics?
Look at alerts in real time, review trends weekly and revisit targets such as SLOs and alert thresholds every quarter or after a major incident.